Global’s July 2026 Stocks Estimated Below Intrinsic Value

In July 2026, global markets have experienced a mix of volatility and resilience, with major U.S. equity indexes facing declines amid tech sector challenges and geopolitical tensions influencing energy prices. Despite these fluctuations, the cooling inflation data has eased rate hike expectations, providing a nuanced landscape for investors seeking opportunities in undervalued stocks.
In such an environment, identifying stocks estimated to be below their intrinsic value can offer potential investment opportunities as they may provide growth prospects when market conditions stabilize or improve.
Top 10 Undervalued Stocks Based On Cash Flows
| Name | Current Price | Fair Value (Est) | Discount (Est) |
| SK oceanplantLtd (KOSE:A100090) | ₩18350.00 | ₩36234.50 | 49.4% |
| Nippon Thompson (TSE:6480) | ¥1758.00 | ¥3482.35 | 49.5% |
| New Wave Group (OM:NEWA B) | SEK90.35 | SEK179.09 | 49.5% |
| Mips (OM:MIPS) | SEK378.20 | SEK748.05 | 49.4% |
| Matrix Design (SZSE:301365) | CN¥36.66 | CN¥73.21 | 49.9% |
| JOST Werke (XTRA:JST) | €55.70 | €111.34 | 50% |
| Info-Tech Systems (SGX:ITS) | SGD0.98 | SGD1.94 | 49.5% |
| Casta Diva Group (BIT:CDG) | €3.02 | €6.03 | 49.9% |
| Cambi (OB:CAMBI) | NOK21.50 | NOK42.71 | 49.7% |
| Allgeier (XTRA:AEIN) | €16.00 | €31.99 | 50% |
Let’s uncover some gems from our specialized screener.
Overview: SK oceanplant Co.,Ltd. operates in South Korea, focusing on the manufacturing of steel and stainless steel pipes, hull blocks, and shipbuilding equipment, with a market cap of ₩1.08 trillion.
Operations: SK oceanplant Ltd. generates revenue through the production of steel and stainless steel pipes, hull blocks, and shipbuilding equipment in South Korea.
Estimated Discount To Fair Value: 49.4%
SK oceanplant Ltd. is trading at ₩18,350, significantly below its estimated future cash flow value of ₩36,234.5, indicating it may be undervalued based on cash flows. Recent earnings show a substantial increase in net income to KRW 9.86 billion from KRW 4.39 billion year-on-year. Earnings are forecast to grow at 32.5% annually, outpacing the Korean market’s growth rate of 32%. However, share price volatility remains high and return on equity is projected to be low at 8.8%.
Overview: Socionext Inc. is a global company that designs, develops, manufactures, and sells system-on-chip (SoC) solutions and services, with a market capitalization of ¥433.61 billion.
Operations: The company’s revenue segment primarily consists of SoC developed with The Solution SoC, amounting to ¥200.83 million.
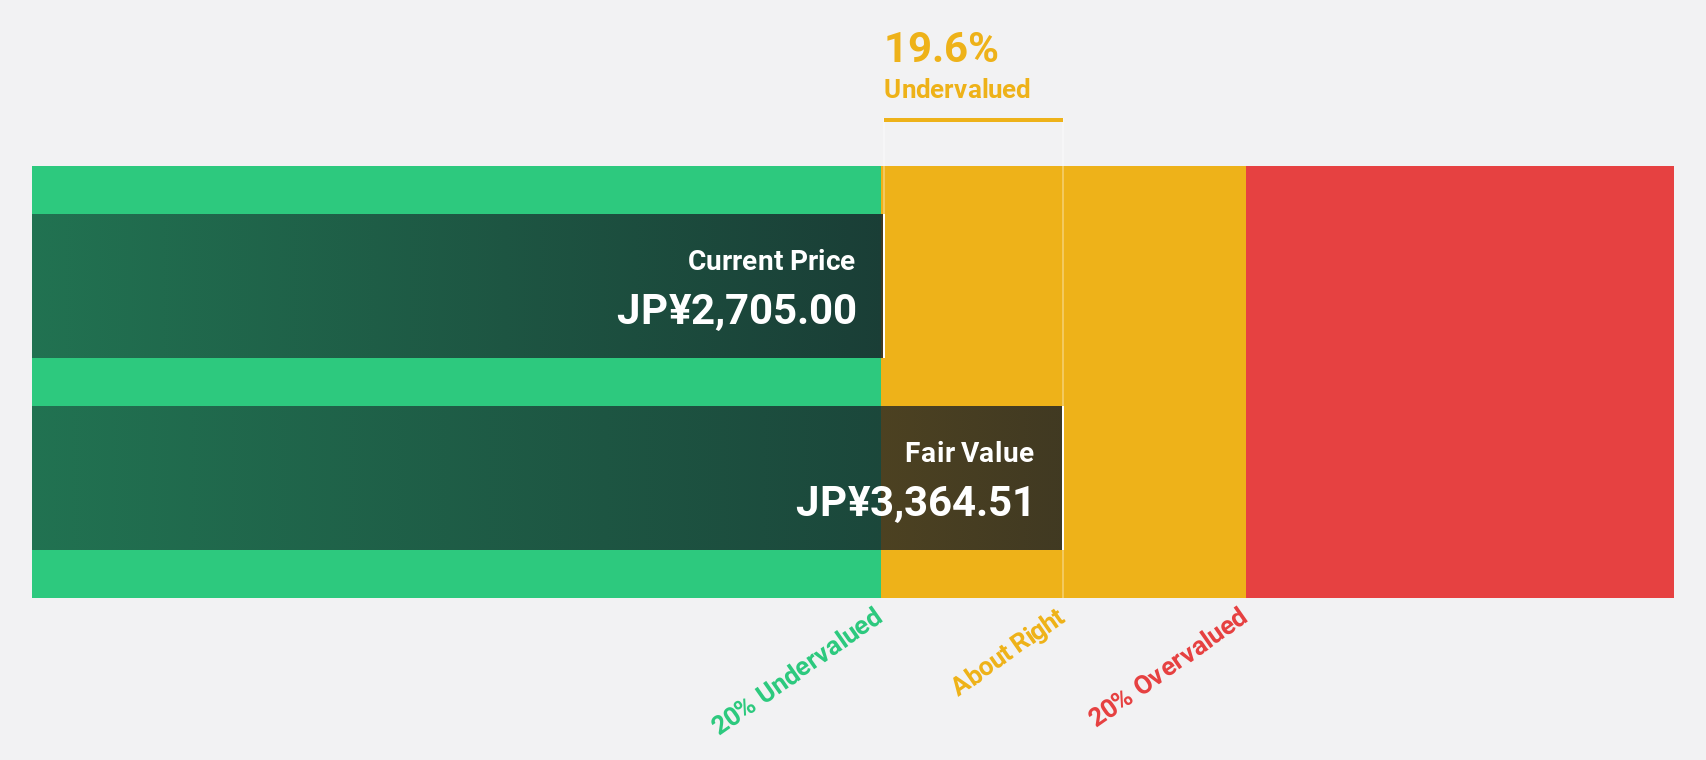
Estimated Discount To Fair Value: 40.8%
Socionext is trading at ¥2,395, significantly below its estimated future cash flow value of ¥4,043.02, highlighting potential undervaluation based on cash flows. Despite a decline in net income to ¥8.73 billion from ¥19.6 billion year-on-year and lower profit margins (4.3% vs 10.4%), earnings are expected to grow significantly by 29.39% annually, surpassing the JP market’s growth rate of 10.1%. However, share price volatility and low dividend coverage persist as concerns.
Overview: Silergy Corp. designs, manufactures, and sells integrated circuit products and related technical services globally, with a market cap of NT$184.27 billion.
Operations: The company generates revenue of NT$19.58 billion from its semiconductor segment, focusing on integrated circuit products and technical services in China and internationally.
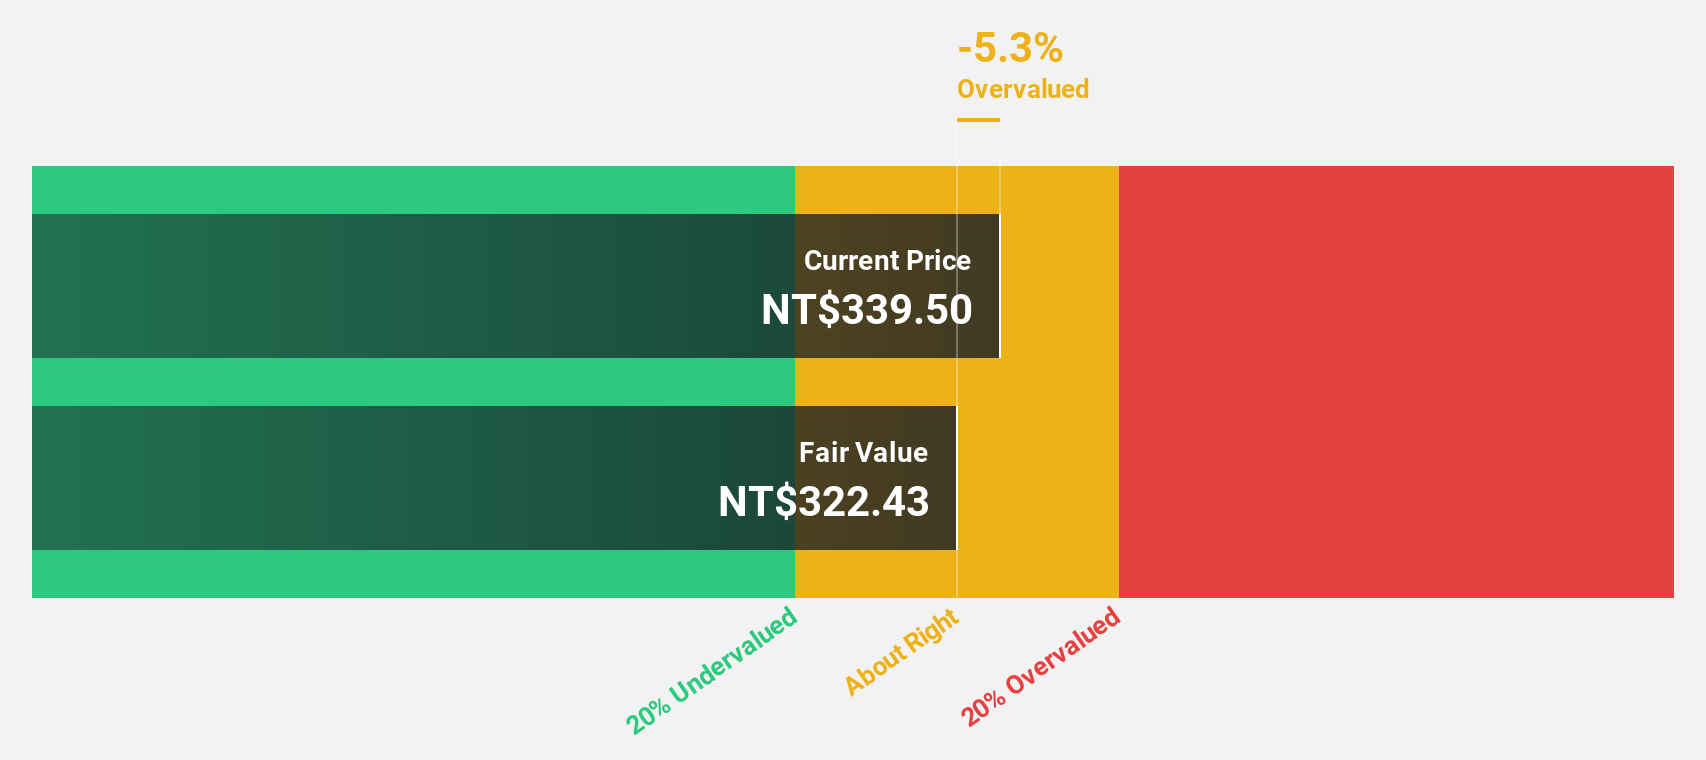
Estimated Discount To Fair Value: 14.6%
Silergy Corp. is trading at NT$467.5, below its estimated future cash flow value of NT$547.57, indicating potential undervaluation based on cash flows. Recent earnings showed a net income increase to TWD 768.71 million from TWD 358.56 million year-on-year, with revenue growth expected at 21.7% annually, outpacing the TW market’s growth rate of 20.5%. However, share price volatility and a forecasted low return on equity of 15.7% remain concerns.
Key Takeaways
Ready To Venture Into Other Investment Styles?
This article by Simply Wall St is general in nature. We provide commentary based on historical data
and analyst forecasts only using an unbiased methodology and our articles are not intended to be financial advice.
It does not constitute a recommendation to buy or sell any stock, and does not take account of your objectives, or your
financial situation. We aim to bring you long-term focused analysis driven by fundamental data.
Note that our analysis may not factor in the latest price-sensitive company announcements or qualitative material.
Simply Wall St has no position in any stocks mentioned.
New: Manage All Your Stock Portfolios in One Place
We’ve created the ultimate portfolio companion for stock investors, and it’s free.
• Connect an unlimited number of Portfolios and see your total in one currency
• Be alerted to new Warning Signs or Risks via email or mobile
• Track the Fair Value of your stocks
Have feedback on this article? Concerned about the content? Get in touch with us directly. Alternatively, email editorial-team@simplywallst.com